AI ROI in 2026: Payback Benchmarks and a Quantification Framework from 36 Deployments [Research]
The headline numbers
Across 36 tracked enterprise AI deployments spanning customer service, engineering, manufacturing, and financial services, the results split into a familiar and uncomfortable pattern: a minority deliver outsized returns, a middle band delivers partial returns, and a meaningful share never reach payback at all. Broader industry data backs the same shape — roughly 5% of companies achieve substantial AI ROI, 35% report partial returns averaging about 1.7× payoff, and typical payback periods run 2 to 4 years — three to four times longer than a conventional technology deployment.
Payback benchmarks by function
| Function | Median payback | Notes |
|---|---|---|
| Customer service | ~4.1 months | Fastest-paying function; 63% of programs reach payback within year one |
| Marketing operations | ~6.7 months | Strong when paired with brand-guardrail evaluation, not left unmonitored |
| Manufacturing predictive maintenance | ~12 months | 200–300% ROI reported in asset-intensive operations, 9–18 month range |
| Financial services back-office automation | ~9–12 months | Reported returns around 3.7x in document-heavy reconciliation work |
| Engineering / developer tooling | ~9.3 months | Value realized through cycle-time reduction, not headcount reduction |
| Agentic / multi-step workflows | Wide spread, some never reach payback | 19% of agentic projects in broader industry data never reach payback |
Why the spread is so wide
The deployments with the fastest, most reliable payback share a structural trait: the metric they were measured against already existed and was already instrumented before the AI project started. Customer service teams already track resolution time; manufacturing plants already track downtime. Deployments in newer functional areas without an established baseline metric take longer to prove value — not because the AI works less well there, but because "did this help" has to be defined from scratch before it can be measured.
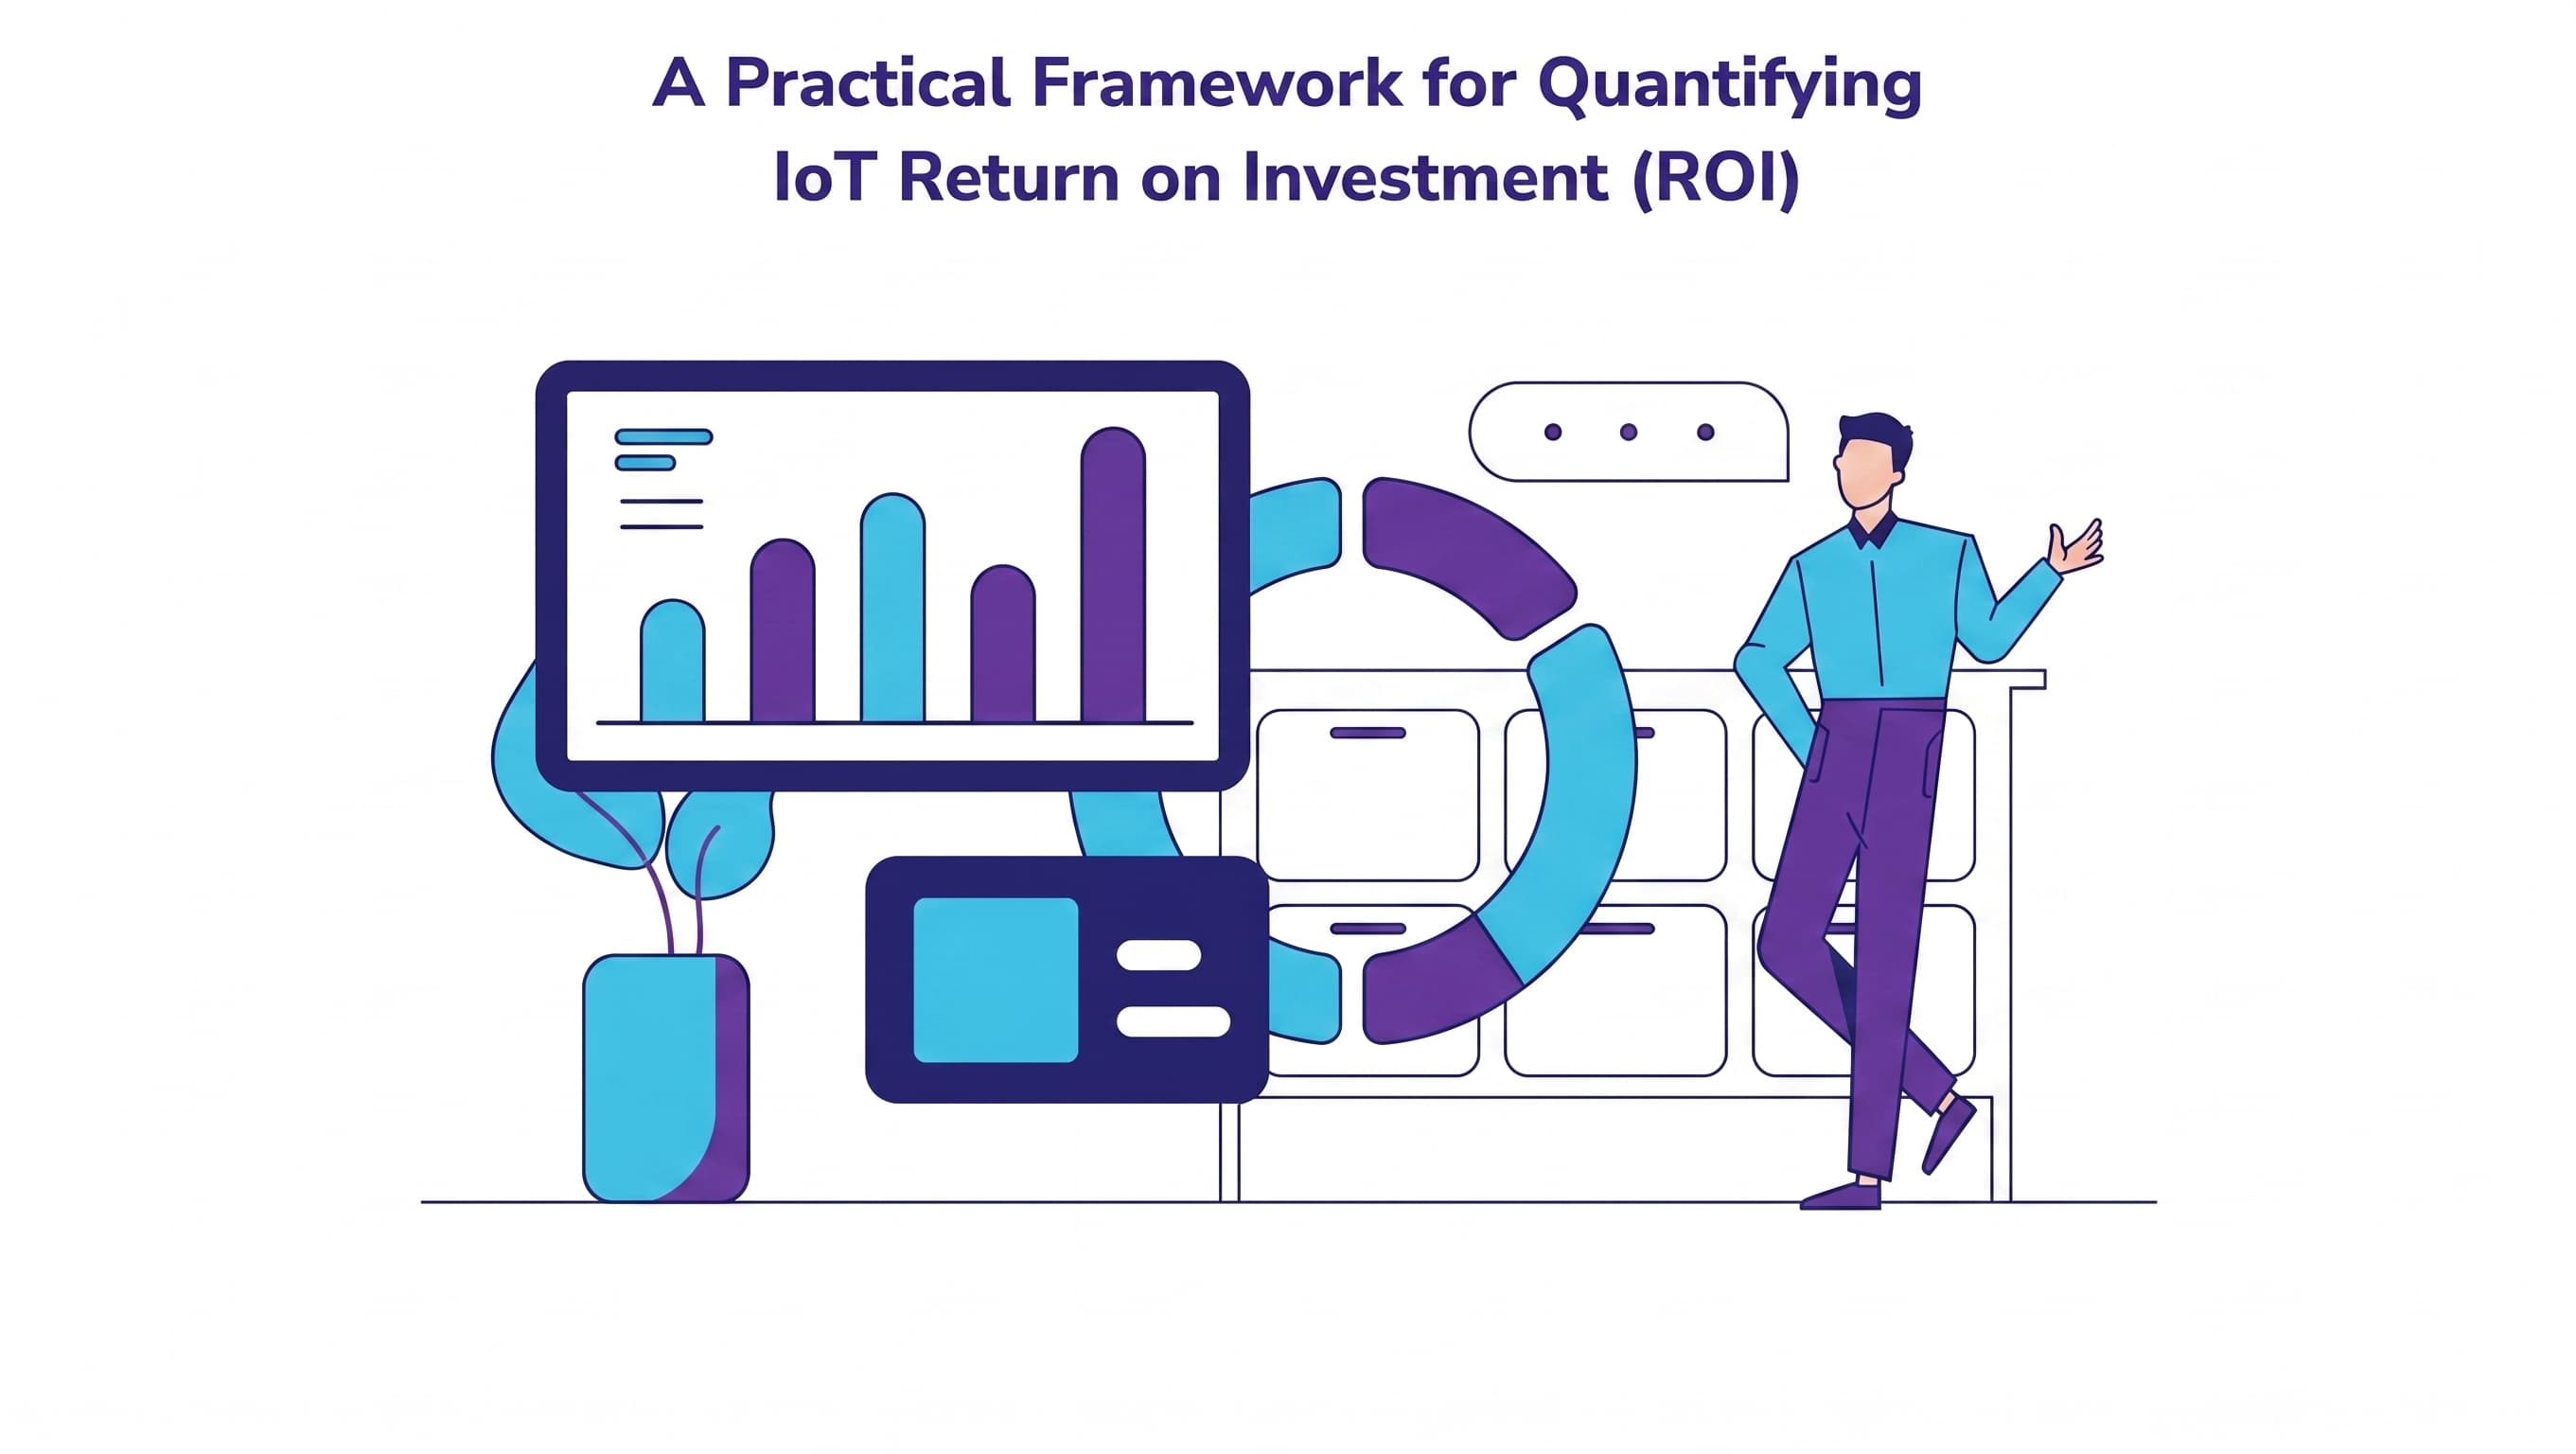
A quantification framework for ROI
- Baseline the metric before building anything. Capture the current value of the KPI the project intends to move, using the same measurement method that will be used after launch.
- Separate hard savings from soft benefits. Reduced processing time is a hard, defensible number. "Improved employee experience" is real but shouldn't be quantified with false precision.
- Include the full cost side, not just infrastructure. Data preparation, evaluation pipeline setup, and ongoing monitoring are real costs that belong in the same calculation as token spend.
- Model payback against realistic adoption, not day-one usage. Most AI tools ramp in usage over several months; a payback model based on immediate full adoption will overstate early ROI.
- Re-measure at a fixed interval, not just once. A single post-launch measurement can catch a temporary spike; re-measuring quarterly catches drift in either direction.
Hard savings vs. soft benefits
| Hard savings (quantify directly) | Soft benefits (track, don't force a number) |
|---|---|
| Reduced average handle time per ticket | Improved customer sentiment |
| Headcount hours reallocated from manual review | Higher team morale from less repetitive work |
| Fewer defects reaching production | Faster "gut feel" decision-making |
| Reduced infrastructure spend from a deprecated legacy process | Improved cross-team collaboration |
The distinction matters because a business case built entirely on soft benefits collapses under scrutiny in the same board meeting that asks for the number twice. Lead with the left column; mention the right column as context, not as a line item in the payback calculation.
Common ROI-calculation mistakes
- Measuring from launch day instead of from the baseline date. If the baseline was captured a month before launch, the clock on payback should start there, not on go-live.
- Comparing against a best-case adoption curve. Real usage ramps unevenly; a payback model that assumes instant full adoption will look wrong within the first quarter.
- Excluding the cost of the evaluation and monitoring pipeline. These are ongoing, real costs — leaving them out inflates the ROI number artificially.
- Declaring victory after one good measurement. A single strong data point can be a novelty effect; re-measuring on a schedule is what distinguishes a trend from a spike.
Applying it before you build
The highest-leverage moment to apply this framework is before the project starts, not after it ships — because step one, baselining the metric, is only possible before the AI system has already changed the process it's meant to improve. Under our Agentic Development Lifecycle, ROI quantification is part of the hypothesis phase for exactly this reason: a payback estimate produced before the pilot starts is what gives a go/no-go decision something real to measure against six months later.
Frequently asked questions
What's a realistic payback period to expect for an enterprise AI project?
It depends heavily on function — customer service and marketing operations commonly pay back within 6–7 months, while manufacturing and financial services automation typically run 9–12 months. Broader averages across all AI initiatives run considerably longer, 2–4 years, which is why function-specific benchmarks are more useful than a single blended number.
Why do agentic AI projects have such a wide spread in payback outcomes?
Agentic workflows are newer and often lack an established baseline metric before the project starts, and their cost scales with call-chain complexity in ways simpler AI features don't. Both factors make ROI harder to measure cleanly and harder to predict up front.
Should soft benefits like 'improved decision quality' be included in an ROI calculation?
They're worth tracking, but should be kept separate from hard, defensible savings rather than blended into one number with false precision. A credible ROI case leads with the hard numbers and lists soft benefits as supporting context, not as quantified line items.
How often should AI ROI be re-measured after a project ships?
At a fixed interval — quarterly is common — rather than once at launch. A single measurement can be skewed by a temporary novelty effect or an early adoption spike; recurring measurement catches both a genuine trend and a regression that a one-time check would miss.
Summary
Across 36 tracked deployments and broader industry data, AI ROI follows an uneven pattern: roughly 5% of companies see substantial returns, about a third see partial returns averaging 1.7x, and typical payback runs 2 to 4 years — several times longer than conventional technology. The spread by function is wide, from customer service paying back in about 4 months to agentic workflows where nearly a fifth never reach payback at all, and the deciding factor is usually whether the metric being improved already existed and was measurable before the project started. A quantification framework applied before building — baseline first, separate hard savings from soft benefits, cost the full picture, model realistic adoption, and re-measure on a schedule — is what turns ROI from a retroactive story into a number decided in advance.