AI Token Cost Calculation: A Pricing-Independent Framework for Forecasting LLM Spend (2026)
Why price-based forecasts break
The standard way teams forecast AI spend is to take a per-token price, multiply by expected volume, and call it a budget. The problem is that both halves of that equation move. Model providers change pricing without much notice, and 73% of enterprise AI projects reviewed in one industry survey ran over budget — some by 2.4× — with unplanned costs averaging roughly $2.3 million per affected project. A forecast anchored to a price sheet is only as good as that price sheet, and it's usually stale within a quarter.
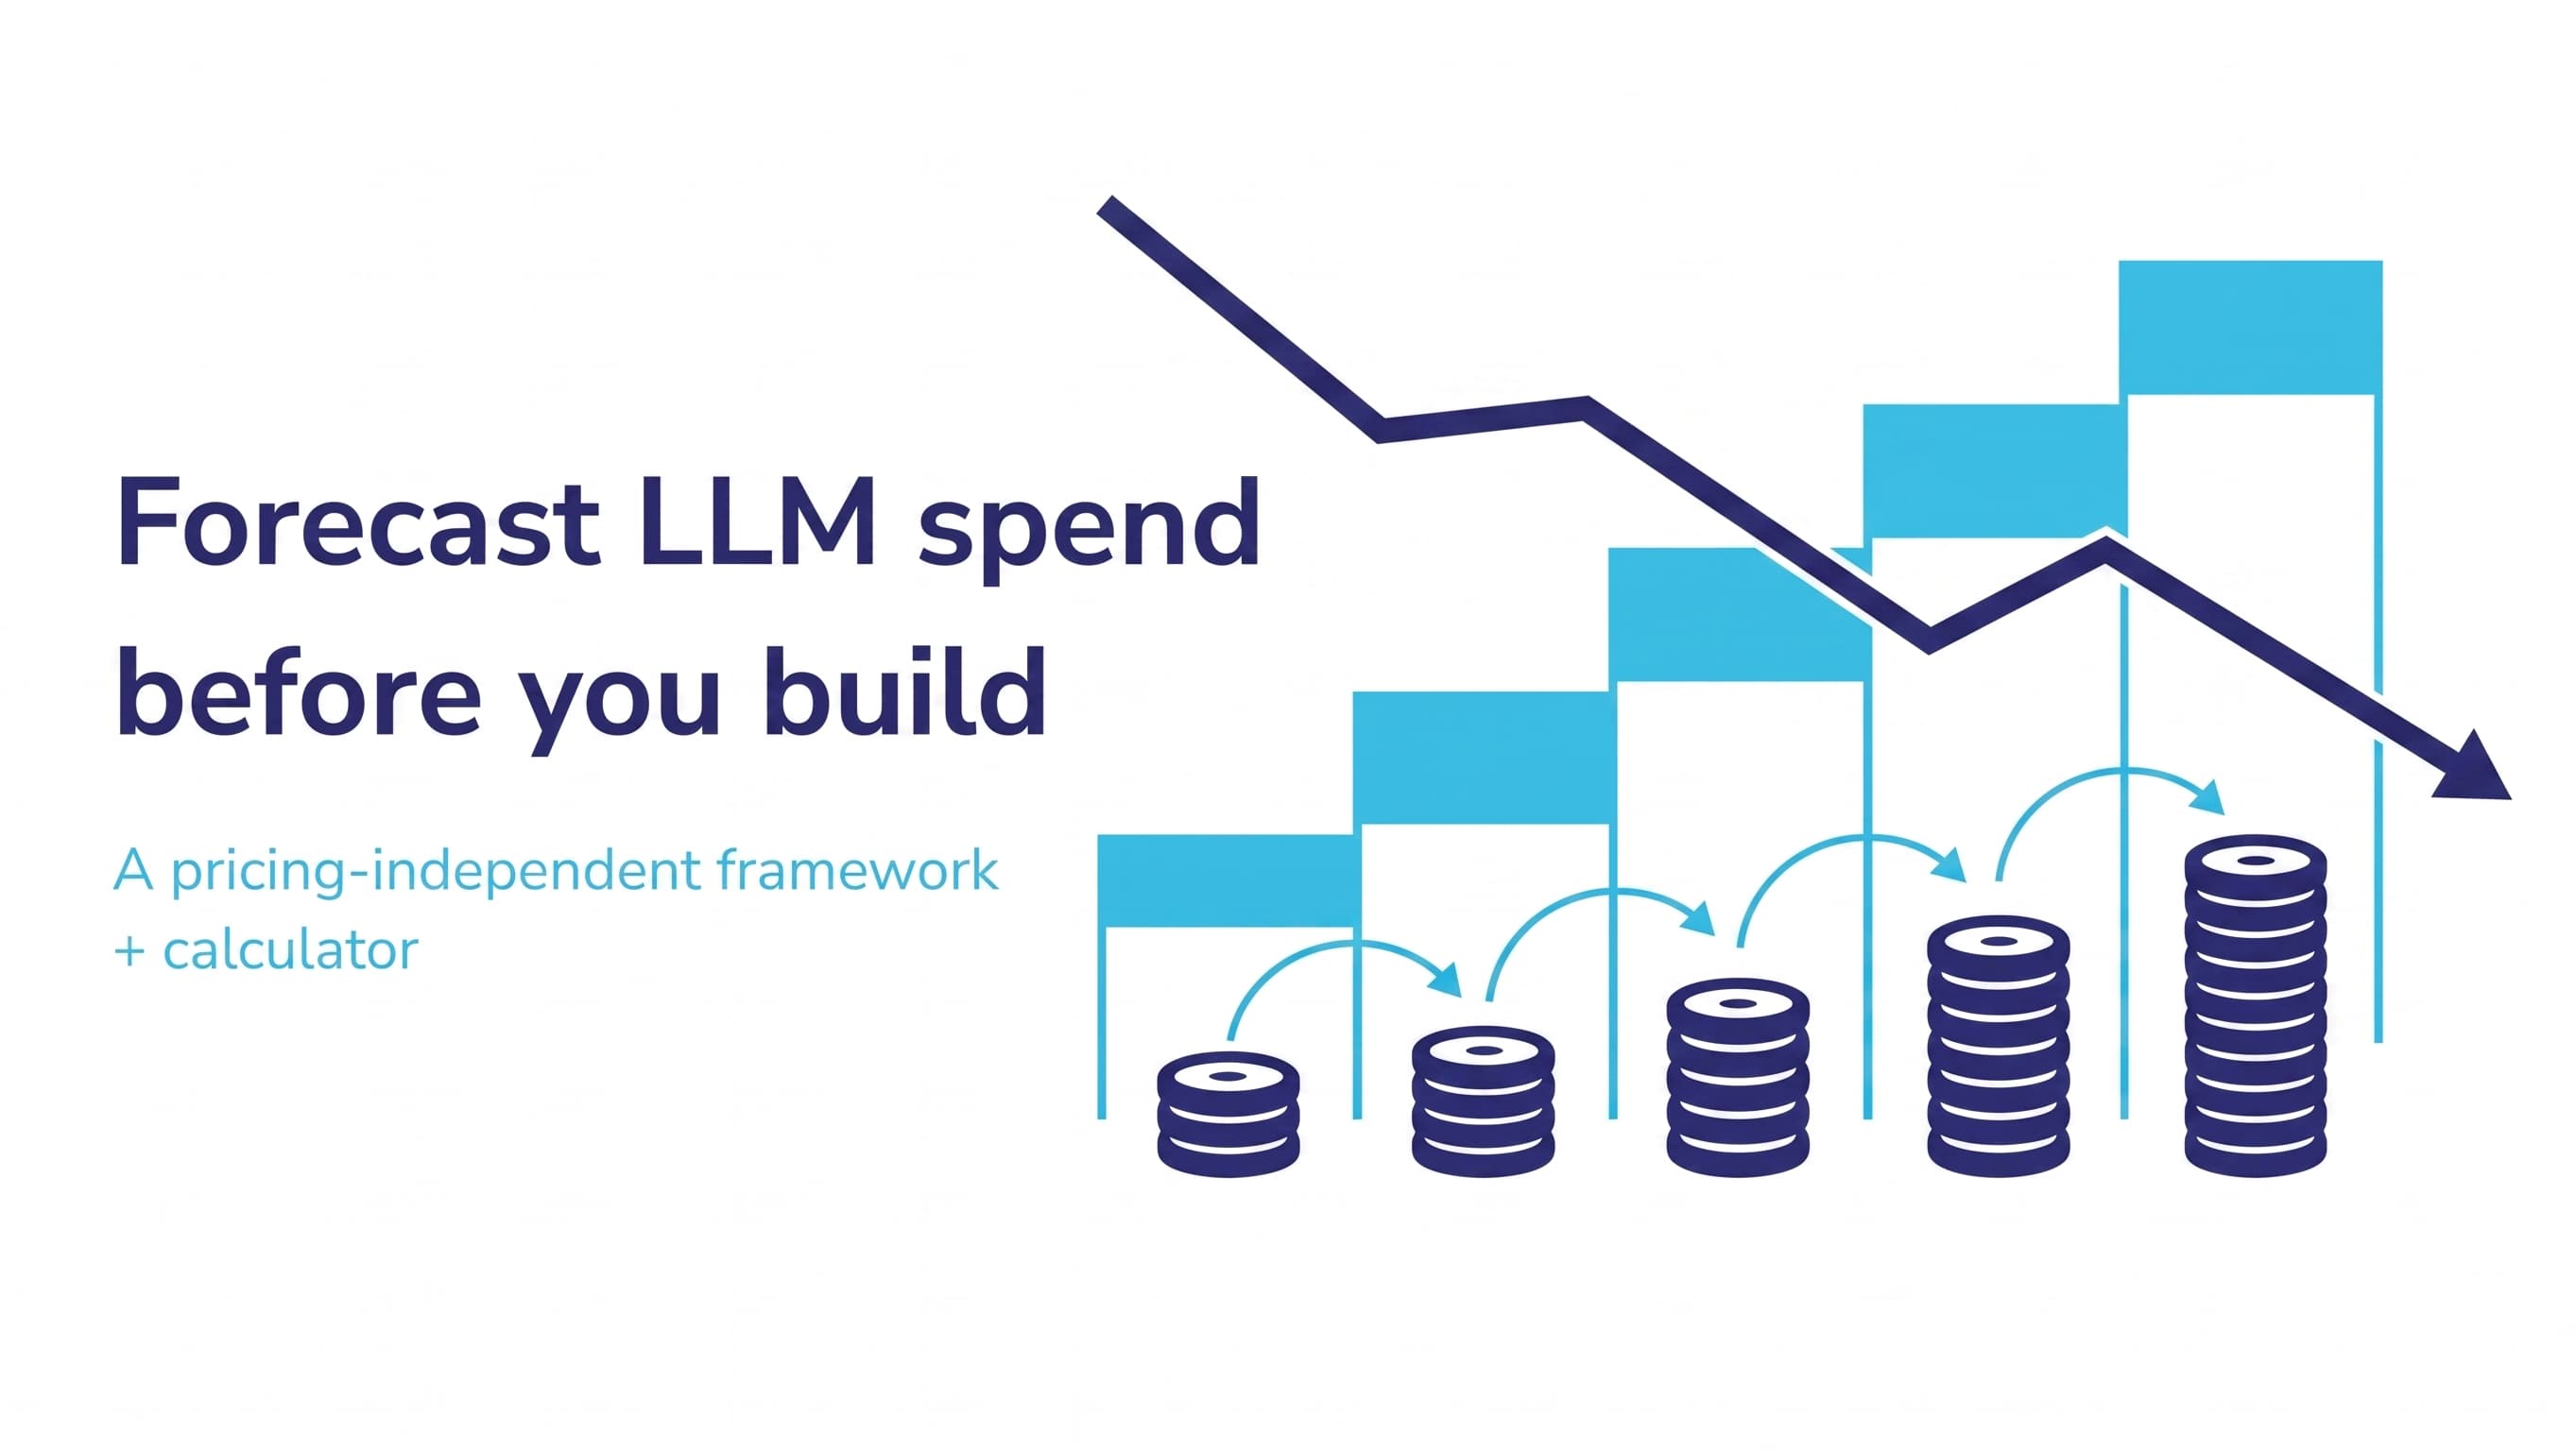
A pricing-independent forecast separates two questions that a price-based estimate collapses into one: how many tokens will this feature actually consume, and what will a token cost when it ships. The first question is stable — it's a property of your product's usage pattern. The second question changes constantly and should be re-plugged into the model, not re-derived from scratch, whenever it moves.
The five drivers that actually determine cost
- Prompt length. System instructions, few-shot examples, and conversation history that get sent with every single call.
- Retrieved context volume. How much a RAG pipeline pulls in per query — the single biggest lever most teams haven't tuned.
- Reasoning depth. How much the model "thinks" before answering, which some reasoning-optimized models bill for as output tokens.
- Call-chain length. How many model calls a single user action triggers — trivial for a simple chatbot, and easily 5–20× for a multi-step agent.
- Usage volume and growth rate. The number of users or transactions, and — critically — how fast that number is expected to grow after launch.
The first four drivers determine tokens-per-interaction. The fifth determines how many interactions happen. Multiply them together and you get total token volume — the pricing-independent half of the forecast. Only then does the current price per token get applied, as the one input you should expect to re-check regularly.
A pricing-independent forecasting framework
- Model the interaction, not the feature. Break the feature into its distinct call types (a classification call, a retrieval call, a generation call) and estimate tokens for each separately — they rarely cost the same.
- Measure call-chain length empirically. For agentic features, instrument the pilot and measure actual calls-per-task; don't assume a single call per user action.
- Forecast volume with a growth curve, not a flat number. Usage in month one and usage in month twelve are rarely the same order of magnitude — model both.
- Keep the price input separate and swappable. Structure the model so a provider price change is a single variable update, not a full re-forecast.
- Set a cost-per-interaction ceiling. Define the maximum acceptable cost for a single interaction up front, so a runaway call chain trips an alert instead of quietly compounding.
A worked example
| Call type | Avg. tokens/call | Calls per interaction | Tokens per interaction |
|---|---|---|---|
| Intent classification | ~300 | 1 | ~300 |
| Retrieval + context assembly | ~1,800 | 1 | ~1,800 |
| Answer generation | ~900 | 1 | ~900 |
| Escalation / re-plan (occurs on ~15% of interactions) | ~2,500 | 0.15 | ~375 |
| Total (weighted average) | — | — | ~3,375 |
That per-interaction token count is the durable output of the exercise. Multiply it by projected monthly interaction volume to get a token-volume forecast, and only at that final step apply the current market price per token — the number most likely to be different by the time the feature actually ships.
Common forecasting errors
- Estimating tokens from a demo prompt, not a representative one. A hand-picked demo query is usually shorter and cleaner than what real users actually send.
- Ignoring the escalation path. The rare, expensive re-plan or retry case contributes more to the average than its low frequency suggests — it belongs in the model, not treated as noise.
- Forecasting flat volume. Assuming month-one usage holds steady, when most features ramp for several months after launch as adoption spreads.
- Mixing pricing tiers into the token count. Input tokens, output tokens, and cached tokens are often priced differently — folding them into one blended number hides where the real cost sits.
Modeling best- and worst-case scenarios
A single point estimate invites false confidence. Modeling three scenarios against the same usage-driver framework — not three different frameworks — keeps the range honest:
- Best case. Call-chain length and escalation rate at their observed pilot minimums, adoption ramping on the slower end of the growth curve.
- Expected case. The weighted-average numbers from the worked example above, at the adoption curve's median projection.
- Worst case. Escalation rate and call-chain length at their observed pilot maximums, adoption ramping faster than expected — the scenario a cost-per-interaction ceiling is specifically there to contain.
The gap between best and worst case is itself useful information — a narrow gap means the forecast is on solid ground; a wide one is a signal to instrument the pilot more before committing to a budget number leadership will hold the team to.
Keeping the forecast honest after launch
A forecast built this way keeps working after launch, because re-pricing it when a provider changes rates is a one-line update, not a re-derivation. Under our Agentic Development Lifecycle, we build this token-volume model during discovery, before committing to an architecture, and re-check it against real production telemetry once the feature is live — so the number that reaches the budget conversation is grounded in actual usage drivers, not a price sheet that may already be out of date.
Frequently asked questions
Why does a per-token price estimate usually turn out wrong?
Because it treats price as the only variable, when volume and per-call token consumption are just as important and much less visible up front. Provider pricing also changes independently of your usage, so a forecast anchored to today's price sheet starts drifting the moment pricing moves.
What's the biggest single driver of unexpectedly high token spend?
Call-chain length in agentic features. A simple chatbot might make one model call per user message; a multi-step agent that re-plans and calls tools can make five to twenty calls for what looks like a single user action, and that multiplier is easy to underestimate before the pilot is instrumented.
How often should a token cost forecast be updated?
The usage-driver half of the model — tokens per interaction, call-chain length — only needs updating when the feature itself changes. The price-per-token half should be re-checked whenever a model provider announces a pricing change, which in 2026 has been a recurring, not rare, event.
Can this framework be used before a feature is built, or only after it's live?
It's most valuable before launch, during discovery — that's when a token-volume estimate can still influence architecture decisions like retrieval scoping or model tiering. It should then be re-validated against real telemetry once the feature is live, since actual usage patterns rarely match the pre-launch estimate exactly.
Summary
Forecasting AI spend by multiplying today's per-token price by expected volume breaks the moment either number moves — and both move constantly. A pricing-independent framework separates the two: model tokens-per-interaction from five concrete drivers (prompt length, retrieved context, reasoning depth, call-chain length, and usage volume), forecast total token volume from that, and only then apply the current market price as a single swappable input. Built this way, a re-pricing from a model provider is a one-line update instead of a full re-forecast — which is what keeps the number that reaches the budget conversation trustworthy months after it was first modeled.